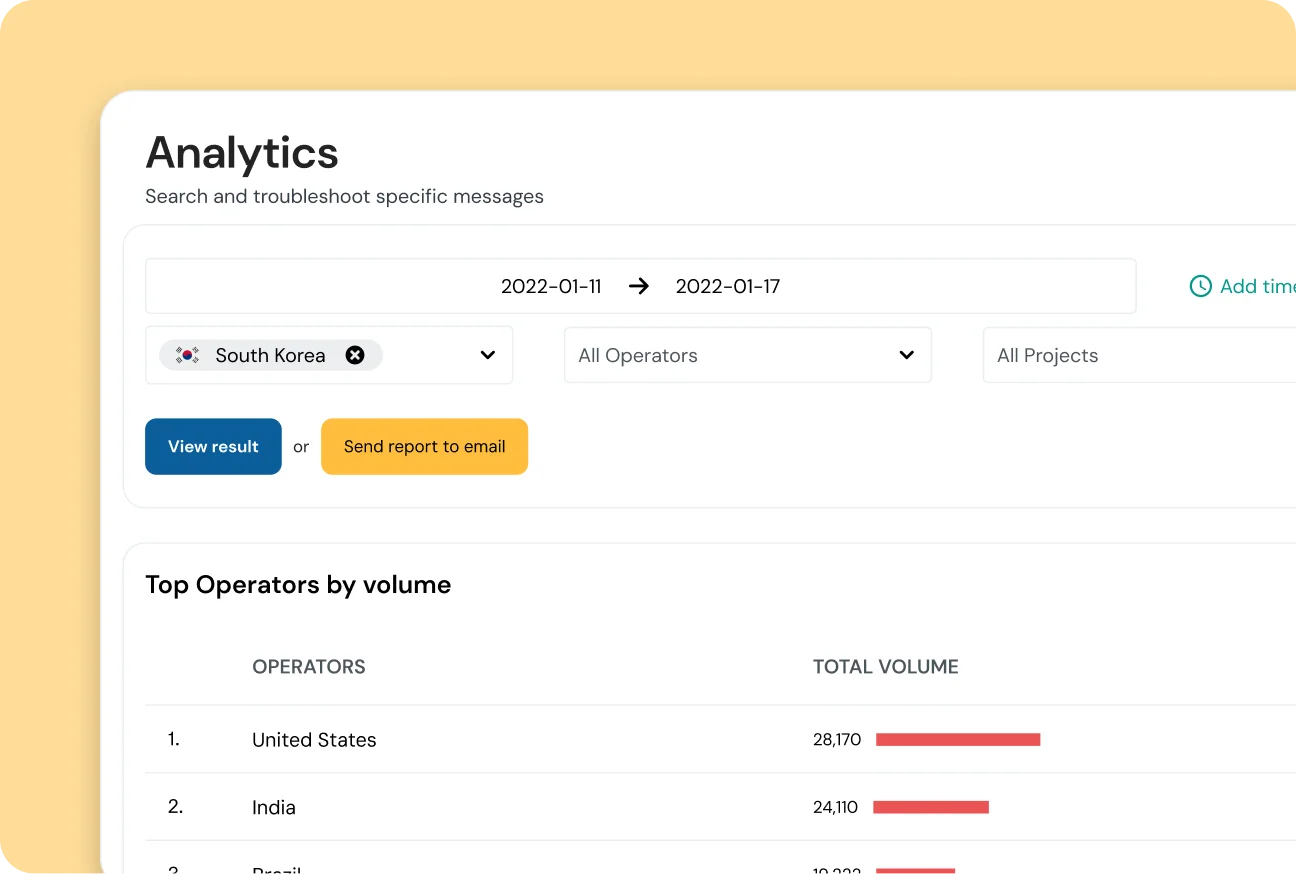
With the Analytics Dashboard, part of the Sinch Conversation API, get a clear, complete picture of your messaging traffic, costs, and delivery performance across every channel in a simple, easy-to-use dashboard.
ANALYTICS DASHBOARD
See every message, cost, and delivery status at a glance
Join over 200,000 businesses, including 8 of the 10 largest tech companies in the world


